Network Troubleshooting utilities and tools are used by network engineers to diagnose and resolve network issues or problems. The common type of network troubleshooting utilities and tools is the command-line tools and they include: ping, traceroute, debug, etc.
1. Ping (Network troubleshooting utilities)
Ping as one of the network troubleshooting utilities and tools is one of the most valuable and well-known troubleshooting tools in networking. It uses a protocol known as ICMP (Internet Control Message Protocol). Ping uses two ICMP message types: Type8/Code0 (Echo Request) and Type0/Code0 (Echo Reply).
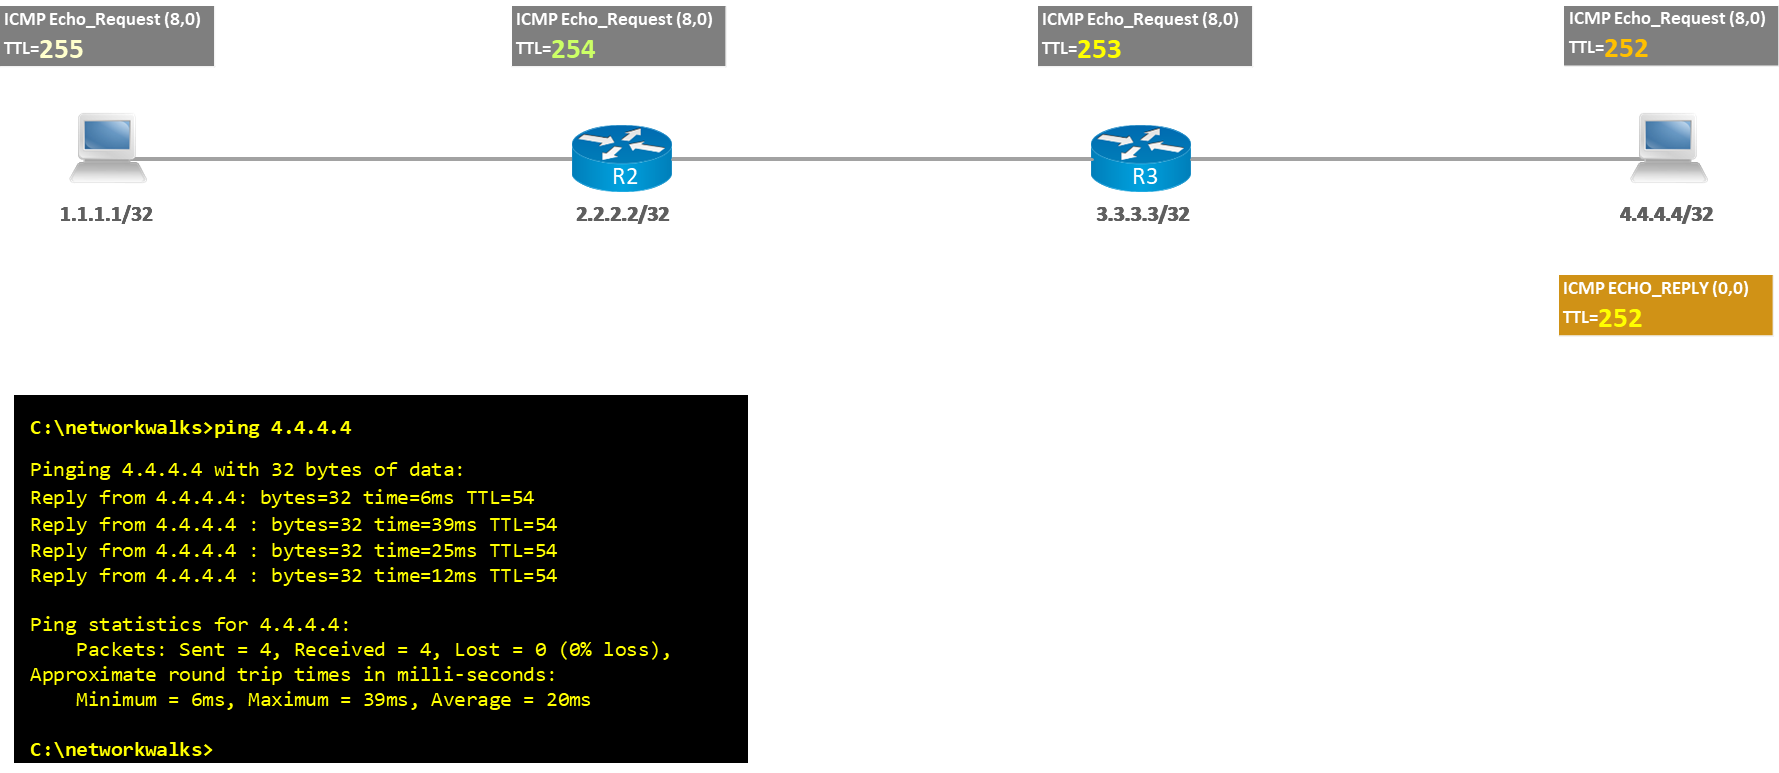
When you issue a ping command, the source sends an ICMP Echo Request to the destination. If the destination is available and is allowed to respond, then it replies with an ICMP Echo Reply. Once the message returns to the source, the ping command displays a success/failure message. Time shows the latency between the source and the destination while TTL tells how many hops are there between source & destination.
When following a troubleshooting flow or logic, it is crucial to cover the basics first.
For example, if a BGP peering adjacency is not coming up, it would be sensible to confirm basic reachability between the two peers before doing any deep-dive BGP troubleshooting or debugging, issues often lie in a lower level of the OSI model; physical layer issues, such as a cable being unplugged, can be found with a quick ping
Ping Extended Options
We can use different ping options to make it more useful for troubleshooting as in below:
R1# ping 10.0.0.1 ?
data specify data pattern
repeat specify repeat count
size specify datagram size
source specify source address or name
timeout specify timeout interval
..
Example
R1# ping

Protocol [ip]:

Target IP address: 22.22.22.23

Repeat count [5]: 1

Datagram size [100]: 1500

Timeout in seconds [2]: 1

Extended commands [n]: yes

Source address or interface: Loopback101

Type of service [0]: 184

Set DF bit in IP header? [no]: yes

Validate reply data? [no]:

Data pattern [0xABCD]: 0xABBA

Loose, Strict, Record, Timestamp, Verbose[none]: Timestamp

Number of timestamps [ 9 ]: 3

Loose, Strict, Record, Timestamp, Verbose[TV]:

Sweep range of sizes [n]:

Type escape sequence to abort.

Sending 1, 1500-byte ICMP Echos to 22.22.22.23, timeout is 1 seconds:

Packet sent with a source address of 11.11.11.11

Packet sent with the DF bit set

Packet has data pattern 0xABBA

Packet has IP options: Total option bytes= 16, padded length=16

Timestamp: Type 0. Overflows: 0 length 16, ptr 5

...

Reply to request 0 (1 ms). Received packet has options

Total option bytes= 16, padded length=16

Timestamp: Type 0. Overflows: 1 length 16, ptr 17

Time=*08:18:41.697 PST (838005A1)

Time=*08:18:41.698 PST (838005A2)

Time=*08:18:41.698 PST (838005A2)

>>Current pointer<<

Success rate is 100 percent (1/1), round-trip min/avg/max = 1/1/1 ms
How does Ping work?
The picture illustrates how the ping utility actually works:

2. Traceroute
Traceroute which is also among the network troubleshooting utilities and tools is the second most valuable and well-known troubleshooting tool in networking. Traceroute also uses a protocol called ICMP (Internet Control Message Protocol). It makes use of different ICMP message types: Type8/Code0 (Echo Request) and Type0/Code0 (Echo Reply) or 11/0.x
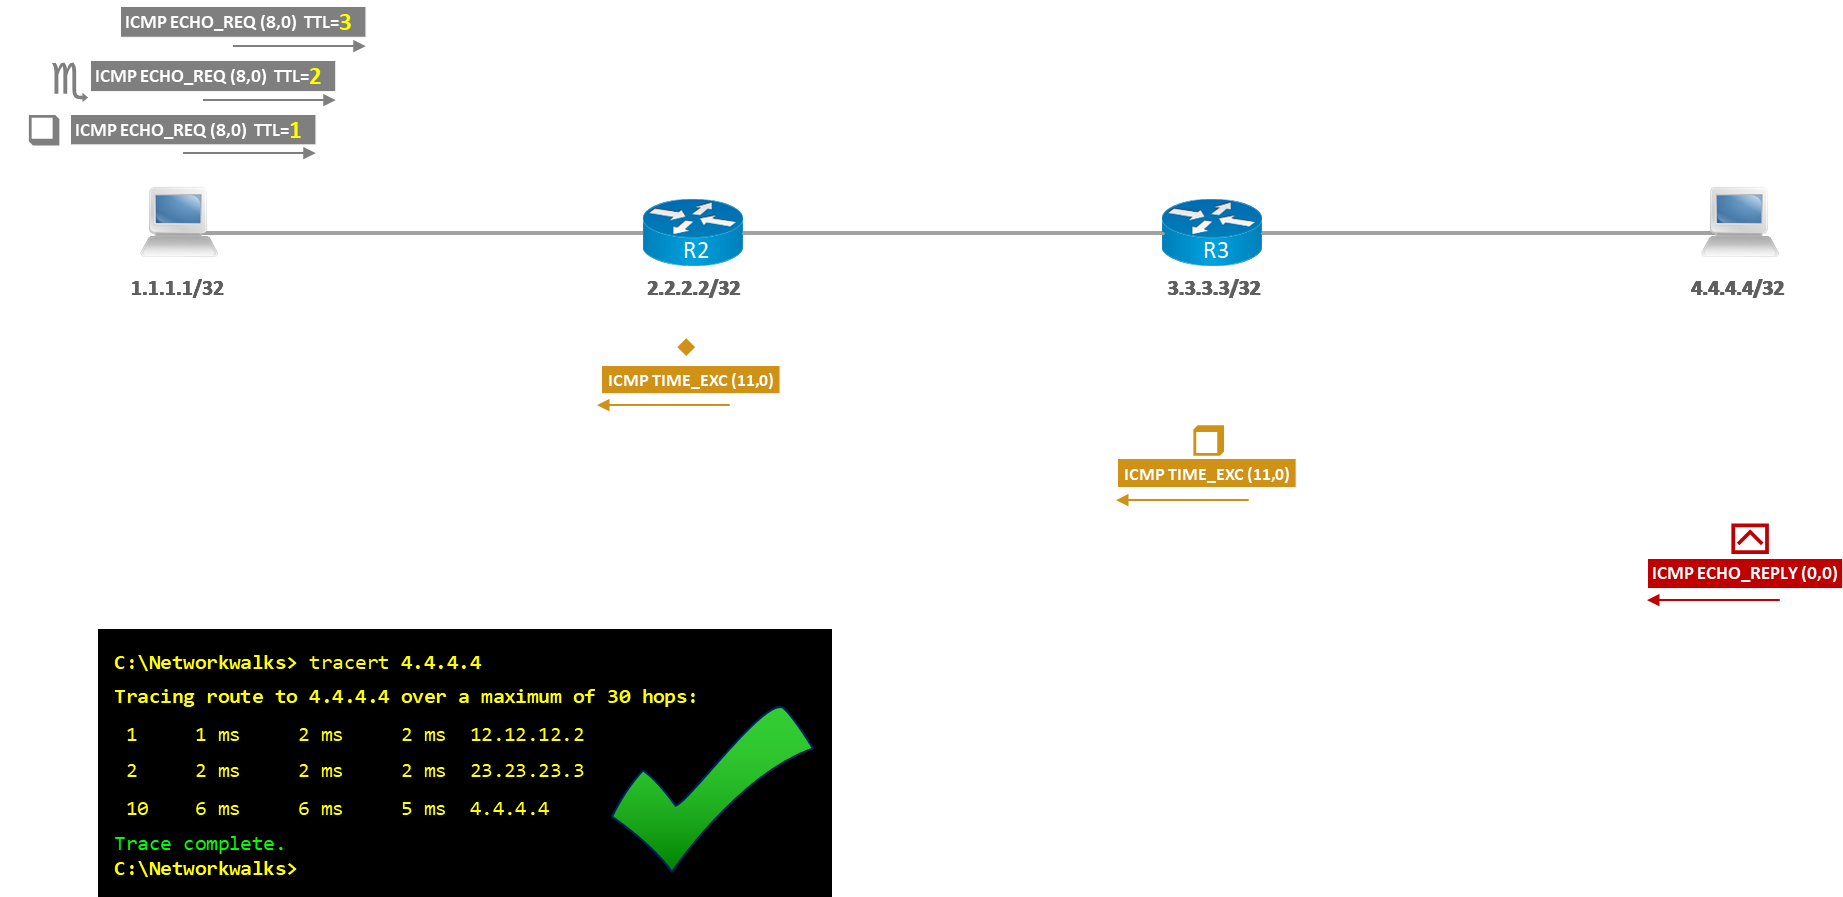
Traceroute is often used to troubleshoot when trying to determine where traffic is failing as well as what path traffic takes throughout the network. Traceroute shows the IP addresses or DNS names of the hops between the source and destination. It also shows how long it takes to reach the destination at each hop, measured in milliseconds.
This tool is frequently used when more than one path is available to the destination or when there is more than one hop to the destination.
How does Traceroute work?
Below is an illustration of how the traceroute utility operates:

3. Debug (Network troubleshooting utilities)
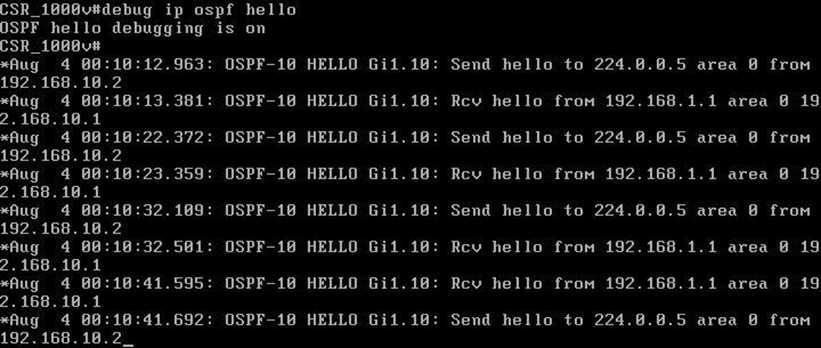
Debug is a network troubleshooting utility or tool used for troubleshooting purposes. It displays information about the Cisco device operations, generated or received traffic, and any error messages.
How to configure Debugging
To configure debugging, simply use the command below:
#debug all
#debug <detail> (for example: #debug ip icmp, #debug ip ospf events)
#undebug all (to disable all)
#logging on (by default Cisco IOS sends debug output to the console, but we can do it for telnet session as well)

4. Wireshark (Network troubleshooting tools)
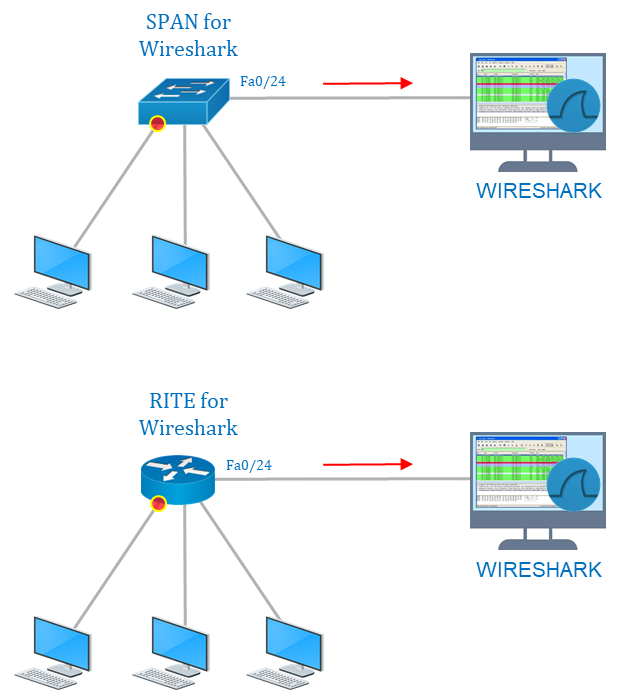
Wireshark is an open-source free packet sniffer and analysis network troubleshooting tool. It captures network traffic on the local network and stores that data for offline analysis. Wireshark can be set up in software form for local traffic of servers/computers. For network setup, we need to enable a port mirroring solution to send all traffic where the Wireshark terminal is connected as shown in this diagram.
Wireshark can be used by network engineers to examine security problems. It is used by network engineers to troubleshoot network issues. It also helps to troubleshoot latency issues and malicious activities on your network. It can also analyze dropped packets. It helps us to know how all the devices like laptops, mobile phones, desktops, switches, routers, etc, communicate in local network or the reset of the world.

How to download and set up Wireshark
- Download Wireshark free from the official website: https://www.wireshark.org/download.html

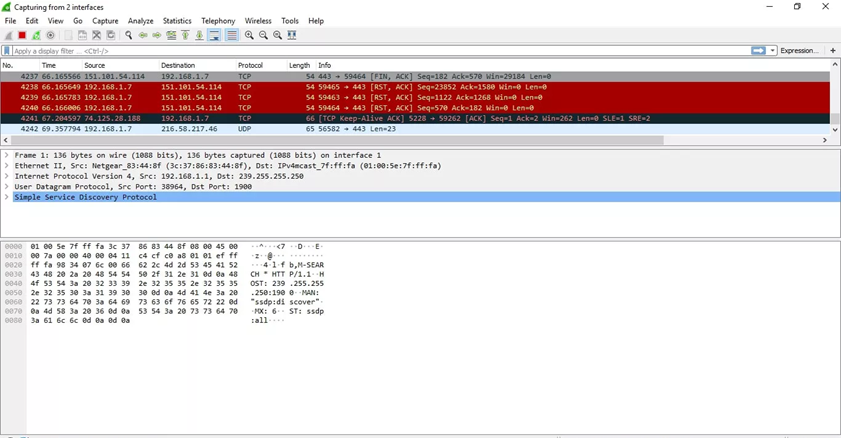
How to View and Analyze Packet Contents
The captured data interface contains three main sections: the packet list pane (the top section), the packet details pane (the middle section), and the packet bytes pane (the bottom section)

1.
No: This field indicates which packets are part of the same conversation. It remains blank until you select a packet.
2.
Time: The timestamp of when the packet was captured is displayed in this column. The default format is the number of seconds or partial seconds since this specific capture file was first created.
3.
Source: This column contains the address (IP or other) where the packet originated.
4.
Destination: This column contains the address to which the packet is being sent.
5.
Protocol: The packet’s protocol name, such as TCP, can be found in this column.
6.
Length: The packet length, in bytes, is displayed in this column.
7.
Info: Additional details about the packet are presented here. The contents of this column can vary greatly depending on packet contents.
Wireshark Filters
- Capture Filters: Capture filters are used to select which packets should be saved to disk while capturing
- Display Filters: Display filters are used to select what you want to see or analyze after capturing
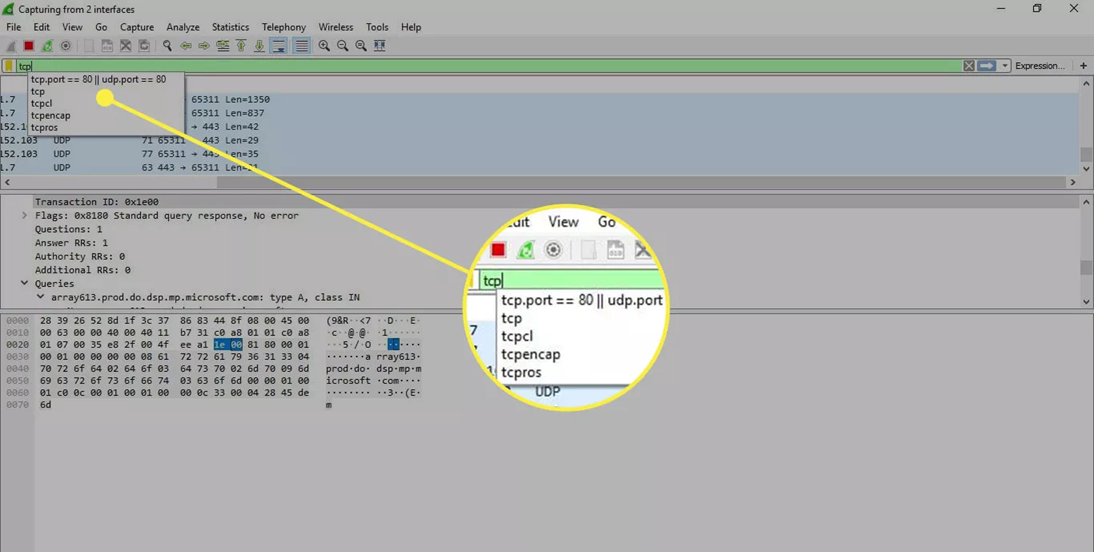
Wireshark provides a large number of predetermined filters by default. To use one of these existing filters, enter its name in the Apply a display filter entry field located below the Wireshark toolbar or in the Enter a capture filter field located in the center of the welcome screen.
For example, if you want to display TCP packets, type the Wireshark autocomplete feature that shows suggested names as you begin typing, making it easier to find the correct moniker for the filter you’re seeking.

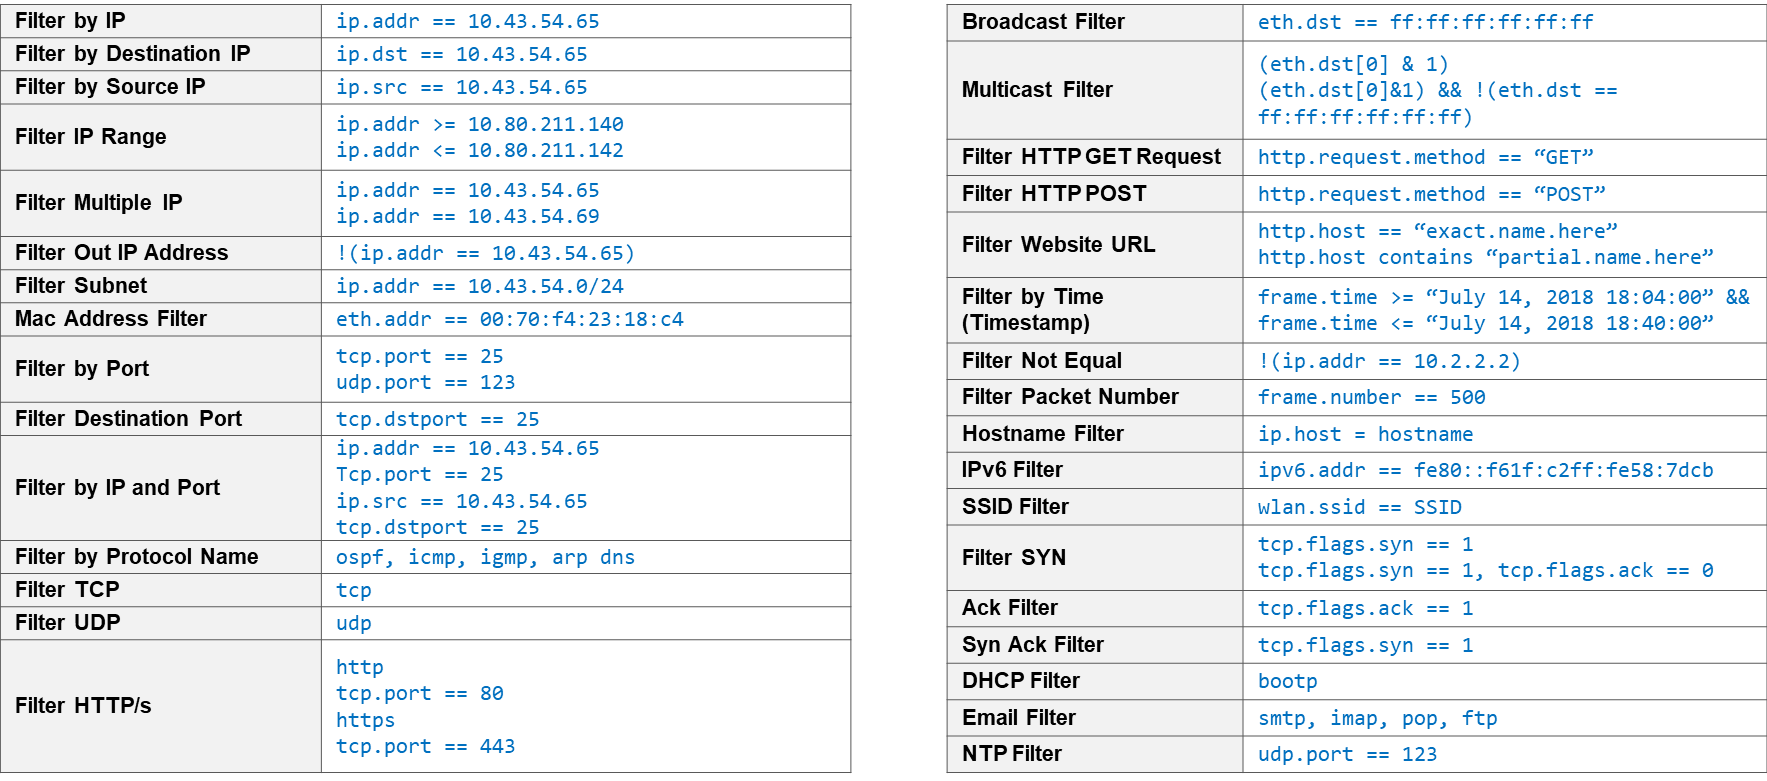
Below are some important Wireshark Filters:

Refer to Wireshark full article here for further detail:
Wireshark
-End-
You might also be interested in our free Online Quizzes on all IT topics including Cisco CCNA, Cyber Security, Python Programming, Linux & Ethical Hacking:
Free Online Quizzes (Best for Cisco CCNA, Huawei HCNA, N+)
You can also view free study notes (Cheat sheets) for long term memory:
Networkwalks Summary Cheatsheets
 Network Troubleshooting utilities and tools are used by network engineers to diagnose and resolve network issues or problems. The common type of network troubleshooting utilities and tools is the command-line tools and they include: ping, traceroute, debug, etc.
